When people finally get their ads up and running, and then actually have some Facebook ad metrics to look at, it’s exciting! So it’s not uncommon to see posts in the Absolute FB Ads Support Group that say something like, “I ran my ads and reached a gazillion people and got 300,000 video views for $0.02 each! That’s good, right???”
Sometimes, though, I have to be the bearer of bad news. I’ll point them in the direction of the chapter on reading your reports, and then they’ll come back and say “Oh. Well I only got a handful of conversions and they were $10 a piece.”
Ouch.
This is something that really pisses me off about Facebook ads: they highlight the numbers that are going to make you HAPPY (or at least optimistic) about your campaigns, and they hide the ones that show you what really happened to your hard-earned money.
(When I say “hide” I mean that they aren’t on display as soon as you open up the Ads Manager. If you know where to look, which is behind the Columns button, then the important metrics are easy to find. And I’m going to help you get there!)
So real quick, here are the metrics I DON’T care about almost ever:
- Reach. Unless you’re spending a LOT of money on ads each day, then your reach simply doesn’t interest me. What I do want to know is what percent of those people are actually responding to your ads. And I hate to break it to you, but that percentage is always going to be reeeeeally small compared to your theoretical reach. So if you’ve reached 120 people with your ads and are worried why no one has signed up for your webinar yet, it’s because 120 people is the Facebook ads-equivalent of, well, NOBODY.
- Clicks. Regardless of the kind of ads you run, you’ll invariably get a ton of clicks that don’t matter. Yes, there is such a click, especially the ones on the name of your page, on the Like button, or on the See More button if you’ve got some long ad copy. Since your objective is probably to get people over to your site, then most of those clicks are irrelevant. This is just another case of Facebook trying to boost your ego with meaningless stats. Ignore it.
- Video Views. Alright, this metric is kinda important if you’re running video ads. But a view is not necessarily a view, OK? Facebook counts a view as anyone who watched your video for 3 seconds or more. And since videos often autoplay in your News Feed, my passive non-watching could be counted as a view if I don’t scroll past it fast enough. There are other more important metrics to consider for video ads, so keep on reading.
- Relevance Score. Ever since relevance scores were introduced, people have been worrying about them big time. But more often than not, you can’t glean a ton of info from these numbers. I’ve seen ads that are performing better than others that have a comparatively low relevance score. Does that mean I’m going to pause the better performing ad? Hell no. I generally ignore this metric. (Update: Facebook came out and said that relevance score wasn’t really a good representation of the health of an ad. So it was replaced!)
So then which Facebook ad metrics actually DO matter?
If we were working on your campaigns together, there are about 14 metrics in total that I would make sure we were looking at. I’ll give you an explanation of each one below, but first you should know how to actually find and analyze the metrics that I’m talking about.
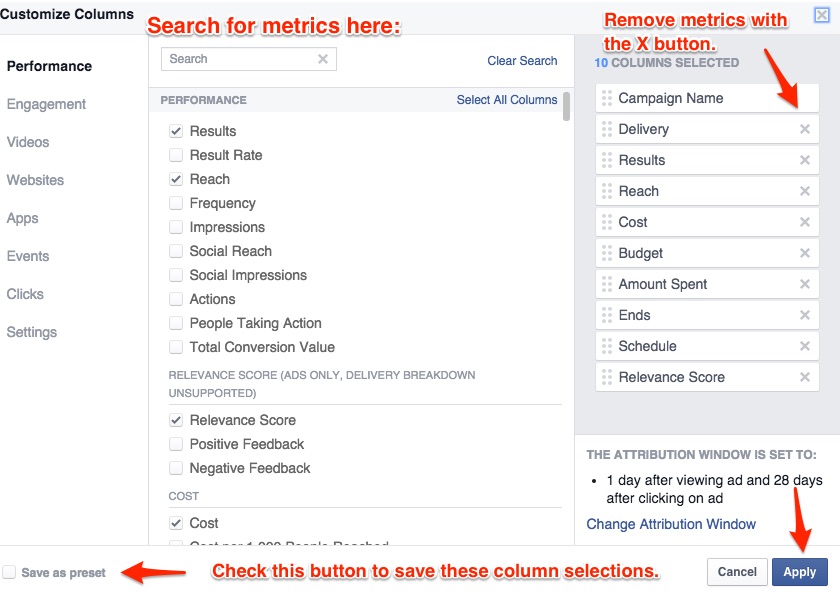
To take a look at the numbers that can actually tell you something useful, go to the Ads Manager and click on the Columns button. Then select Customize Columns. 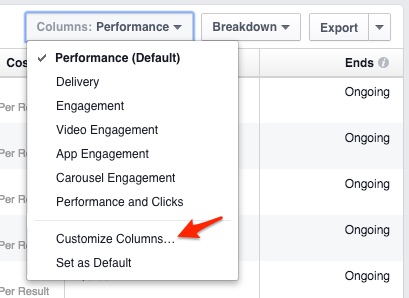 In there you can remove the metrics you don’t want to see and search for and select the ones that I indicate in the lists below.
Once I’m looking at that collection of data, I hit the Breakdown button and choose Placement to see whether my ads did better on mobile or desktop. You can also look at the breakdown by age, gender, country, state (they call it Region) and more.
What follows is an explanation of each of my most valued Facebook ad metrics, and how they fit together to tell you what to do with your campaign next.
For Lead Generation Campaigns
 Here are the important metrics for any campaigns that are driving traffic to a sign-up page of any kind:
- Impressions: the total number of times your ad was shown. This is different from Reach, which is the number of individual people who have seen your ad.
- Cost Per 1,000 Impressions (CPM): the average cost to show your ad 1,000 times. Think of this as Facebook’s price tag; it varies depending on the demand for the audience you’re targeting at the time you’re running ads. Note: it may be cheaper to run the exact same ad on one day compared to the next. You don’t have much control over this, but you may notice that some audiences net higher CPMs on a regular basis. It’s all about supply and demand, baby, so make sure you’re always testing out different audiences.
- Frequency: the average number of times each individual has seen your ad. Calculated by Impressions divided by Reach. This is an important metric to pay attention to to make sure you’re not oversaturating your audience with your ads. I like to keep my Frequency under 4 for ads being shown in the News Feed and under 8 for ads shown in the Right Sidebar.
- Amount Spent: how much you’ve spent running your ads so far. This is set by you in the Budget section of your ad sets.
- Click-through Rate (CTR) Links, a.k.a. Website CTR: the percent of people who saw your ad and clicked over to your opt-in page. Calculated by taking the number of Link Clicks and dividing it by Impressions.
- Link Clicks: the number of people who clicked on your ad and were directed to your opt-in page. This is a good metric to use to estimate the number of people who visited your opt-in page (unless you’re sending people to the same opt-in page from all different sources, which I don’t recommend).
- CPC (Link): the average cost of each click from your ad over to your website. Calculated by taking the Amount Spent divided by the number of Link Clicks.
- Leads: the number of people who signed up on your landing page after clicking on your Facebook ad. (If you set up your conversion tracking pixel with the category Registrations instead of Leads, than you should be looking at Registrations, not Leads.)
- Cost per Lead: how much each sign-up has cost you so far. Calculated by taking the Amount Spent and dividing it by the number of Leads.
What to Do With That Data:
Cost Per Lead is your most important metric. If your leads are more expensive than you’d like – I try not to pay more than $2.50 per lead – then use these numbers to figure out why they’re so high:
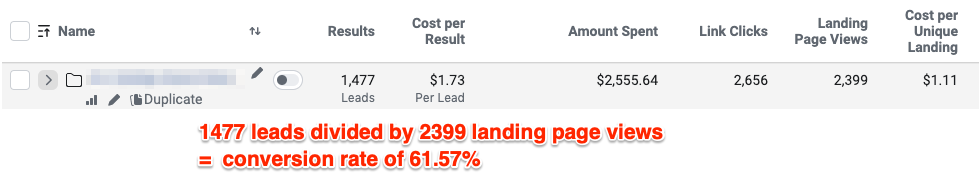
- Divide Link Clicks by Leads to find your landing page’s conversion rate. If it’s below 30% there are lots of things you can do to try improving it.

- If your CTR Links number is low (below 1%), either your ad creative isn’t compelling or you’re targeting the wrong audience. A great way to improve your CTR is by writing more compelling ad copy. Grab a completely free template for writing opt-in ad copy here.
- If your CPM is high, you should try out a different audience.
For Campaigns to Make Sales
 Whenever I’m trying to use ads to make sales, here are the metrics I pay attention to (many of which are the same as above):
- Impressions: the total number of times your ad was shown.
- Cost Per 1,000 Impressions (CPM): the average cost to show your ad 1,000 times.
- Frequency: the average number of times each individual has seen your ad.
- Amount Spent: how much you’ve spent running your ads so far.
- Click-through Rate (CTR) Links, a.k.a. Website CTR: the percent of people who saw your ad who clicked over to your sales page.
- Link Clicks: the number of people who clicked on your ad and were directed to your sales page.
- CPC (Link): the average cost of each click from your ad over to your website.
- Checkouts: the number of people who converted to customers from your ad. This requires you to have set up conversion tracking on the “thank you” page people see after completing their purchase. More info here.
- Cost per Checkout: how much each sale has cost you so far. Calculated by taking the Amount Spent and dividing it by the number of Checkouts.
What to Do With That Data:
Here your priority is how many Checkouts you got and the cost per each. Ideally your Cost Per Checkout is a lot lower than the actual price of your product.
Unhappy with your results? First, make sure you understand that selling cold on Facebook is VERY difficult, which is why I use strategies like this one if I want to make sales. Then I’d do this:
- If your CTR Links number is low (below 1%), either your ad creative isn’t compelling or you’re targeting the wrong audience.
- If your CPM is high, you should try out a different audience.
- Look at the overall sales conversion rate of your sales page using Google Analytics. It’s possible that Facebook ad traffic isn’t interested in opening their wallet to you, but that warmer traffic from your blog or social media is more willing to buy. If that’s the case, trying a retargeting strategy to show Facebook ads to your previous site visitors.
For “Content Awareness” Campaigns (a.k.a. driving traffic to specific blog posts):
- Impressions: the total number of times your ad was shown.
- Cost Per 1,000 Impressions (CPM): the average cost to show your ad 1,000 times.
- Frequency: the average number of times each individual has seen your ad.
- Amount Spent: how much you’ve spent running your ad so far.
- Click-through Rate (CTR) Links, a.k.a. Website CTR: the percent of people who saw your ad and clicked over to your sales page.
- Link Clicks: the number of people who clicked on your ad and were directed to your sales page.
- CPC (Link): the average cost of each click from your ad over to your website.
- Leads: the number of people who opted in for some free content on your site after clicking on your ad and landing on your blog post. (If you set up your conversion tracking pixel with the category Registrations instead of Leads, than you should be looking at Registrations, not Leads.)
- Cost per Lead: how much each sign-up has cost you so far.
Pro Tip: Running content awareness ads without paying attention to people’s actions on your site is a waste of your money. Are people clicking on your ads, reading your posts but then leaving your site? That would tell me that your site needs to be optimized to capture more sign-ups (and doing some work on this will pay off in the long run, I promise).
The good news is that adding custom conversion tracking to your content awareness campaigns will give you all the info you need to know. You may find that some of your blog posts net you a lot of sign-ups, as was the case for this Facebook ad campaign I ran!
What to Do With That Data:
Aside from the number of Leads your Content Awareness Campaign got you, here’s what else to consider:
- If your CPC (Link) is higher than $1.00 (the maximum I’ll spend on clicks over to my blog posts), then checkout your CTR Link number. If it’s lower than 1%, either your ad creative isn’t compelling enough, or you’re targeting the wrong audience with those ads. I’d try testing out a different topic with the same audience first, and then looking for a new one if the CTR doesn’t improve.
For Video Ads
- Frequency: the average number of times each individual has seen your ad.
- Amount Spent: how much you’ve spent running your ads so far.
- Thruplay: the number of times your video has been viewed for 15 seconds or more. This is more valuable info than regular ol’ video views, but still not useful as a standalone metric. You MUST pay attention to:
- Average % of Video Viewed: what percent of your video was actually seen by all the people who “viewed” it.
- Video Views to 75%: what percent of people who “viewed” your video actually watched it until the 75% mark. (That’s almost as good as watching it to the end, don’t you think?)
- Link Clicks: the number of people who saw your video ad and clicked through to your site. They might have clicked on the link that you can add at the very end of the video, or the one you included somewhere in the post.
- CPC (Link): The average cost of each of those clicks over to your site.
- Leads: the number of people who opted in for some free content on your site after clicking from your video ad over to your site. (If you set up your conversion tracking pixel with the category Registrations instead of Leads, then you should be looking at Registrations, not Leads.)
- Cost per Lead: how much each sign-up has cost you so far.
Not 100% sure you have your conversion tracking set up correctly? Get my free checklist here: clairepells.com/trackingchecklist
Some people have found that video ads have worked wonders in terms of driving traffic over to an opt-in page and converting visitors. Most people I’ve spoken to, however, have gotten loads of views but not that many clicks to their site.
The good news, however, is that Facebook will give you an audience of people who “viewed” your ad. If you like, you can choose to retarget those people with other ads, perhaps regular link ads, to promote your free content or product. I do this on a regular basis for myself and my clients – check out this video training for a few examples of when to implement this.
What to Do With That Data:
Take a look at a few numbers to see how you can improve this campaign next time:
- If the Average % of Video Viewed is low, the beginning of your video may not be compelling enough to grab people’s attention and hold it. Or your video may be simply too long; even an engaged viewer can only hold on for so long.
- Check out your Cost Per Lead. If it’s lower than your average cost per leads for non-video campaigns, keep running this video ad! If you’re getting more expensive costs per lead, don’t despair. Those videos views may work in your favor if you retarget those people with a specific ads for something they can’t say no to. After all, if they’re watched your video, even if it’s just a part of it, they’ve already started the process of getting to know you.
What am I missing? Are there any metrics that aren’t on my list that you depend on in judging the health of your campaigns?
Let me know in the comments below!
Discover the specific Facebook and Instagram ads I use every month for myself and my clients in this free masterclass: clairepells.com/optin-5ads


Nice! Thanks Claire. I need to go customize my columns now :)
It’s a whole new world, isn’t it? :)
Claire:
Please telephone Raymond at 253.275.6091 or on this scheduler let me know day and time you are available to have a conversation about your services.
meetme.so/IntroducingLTCI
Raymond
253.275.6091
raymond@lavineltcins.com
Thanks for the tips, Claire! These could definitely help me with my campaigns. Awesome!
You’re welcome, Carla! Thanks for stopping by. :)
I see ‘results’ as a default column on my reports, often telling me how many conversions my ad received. This number seems way off from the registrations/leads and website clicks – do you know what goes into that results number? Should I be ignoring that one, too?
Results “should” be the same as registrations or leads, so long as the objective of your campaign was Website Conversions. If they’re way off, then my guess is that that results column is actually showing you something else. OR you’re tracking multiple conversions and only some of them are actually sign ups. Does that sound about right?
Ah, yes – that does make sense. I have been tracking both a registration pixel and a key web page view pixel, so now I see that the ‘results’ match up to those numbers. Thanks for shedding some light!
Awesome, glad we figured that one out!
Thanks Claire, this was very helpful!
I was testing out the setting to make sure I had them all right but I was unable to find the Website Clicks. I did find Link Clicks, is that the same?
I also wasn’t able to find the CPC Links (although I found CPC (All)).
Did FB change the names or am I missing something? Thanks!
Yes, I think they changed them almost immediately after I published this! Website Clicks = Link Clicks, and the other one is actually CPC (Link).
Great Job
good information! mate I´m running a campaign to promote a app. I´m only interested in the downloads, also I´m using link with counters. but the date from facebook and the counters from the links are completly different. Also I´m a little confused of which is the parameter I need to check, cause I don´t care about likes or comments clicks but is everything in the same bag.
can you help me out?
dansanso is my skype
Claire I actually work for a media company and also own a anal business with my husband. I am new to the world of media as it has been a recent industry change for me but muy husband placed a simple ad for the next 30 days with fb to see what the results would be and I a not quite understanding the metrics just yet. What are post clicks? What metric gives the # of people that actually clicked thru to our FB page? And do likes for the post translate to likes on our page? Thanks in advance and I’ve really enjoyed learning some of the intricacies of this new wide world!
Great article – would love to see updates for 2016….specifically to address estimated ad recall lift on branding/awareness ads.
I’m so glad I found this post. This is the first time I’ve been able to find a clear and straightforward explanation of what I should be looking at and what all the ad jargon means! Thanks so much, J
I’m so glad to hear that, J! Best of luck with your ads. :D
Hi Claire, This post is exactly the kind of post I am looking to read more on.
Say I am to run an online contest campaign and I use FB ads to brings users to a page on my website to read on the details,which they would then be able to participate in the contest (which is not done on the site itself).
Which category then does this type of campaign falls into for me to use the criteria mentioned in your post ? Campaign to generate leads, campaign to promote awareness or campaign to make sales?
If you’re unable to track conversions (meaning people do NOT land on a page on your site AFTER signing up), then it’s technically a campaign to promote awareness because the objective you’ll choose is clicks to website (or “traffic” depending on your version of the interface).
Claire, I discovered your blog and I am so happy. How can someone build something so comprehensive and cool?
This is a great place to start! https://fizzle.co/start-a-blog-that-matters
Thanks!
Thanks for the article! What’s considered a high CPM? You said “If it’s high, target a different audience.” Thanks
Hey Isra, I try to stay below $15 for my CPM, but less than $10 is really my goal!
Thanks. This was insightful. Can you please explain useful matrix for Website Promotion Matrix. What does Link Click and Button Click means?
Take a look at the metrics listed for Content Awareness Campaigns above, those would be the best to use for Website Promotion ads. A Link Click is a click on the ad that sends people to the link you’ve specified when creating the ad. It does not include when people click on the ad in a place that does not send them to the specified link, for example if you have long copy and someone clicks on the ‘read more’ button that would be counted as a Click but not a Link Click. A Button Click is when someone specifically clicks on the Call to Action button that you can choose to include in the bottom right hand corner of your ad. Any clicks here are also counted as Link Clicks.
Great article Claire! It is quite insightful to see all those metrics organized in a way that makes sense. I have found out that the good relevance score sometimes really helps the ad, but it usually rises by itself when the audience is properly targeted and their interests defined. Did you find the PTA metric relevant in any of your Ad summary reports? Thanks and keep up the good work. Cheers
Hey Semir, We don’t find PTA that relevant to the performance of the ads. The only actions that Claire recommends to really worry about are link clicks, sign ups and purchases.
Thanks! This is very helpful, especially when you put in the average numbers you are looking to have or beat when looking at each column. Open Ocean Marketing – Expert of Creating Tribes
Does having a CTR of 2.8% okay? Up until now, I’ve never had any sales or anything. I run an ad to an affiliate link. I keep creating a different ad to replace the current one. Still the same CTR but no results in sales. Though my relevance score is always between 3 or 4. Maybe I’m targeting the wrong audience. I don’t know.
Hi Emmanuel, I wouldn’t be so worried about looking at your CTR but your CTR (links). If the CTR (links) is above 1% then usually it means the ad creative (copy or text is doing ok). Your relevance score is definitely on the low side though, you want it somewhere around 7+. Things that effect the relevance score are negative and positive feedback (if lots of people are blocking your ad etc then FB will give it a lower rel. score), it can also be an indication that the audience isn’t quite right. It’s worth testing some new audiences and making sure that what you choose is really specific.
Claire. This is an excellent piece of article for measurement. There are many measurements, but it is always confusing on which one to use when. This article helps every marketer to measure the right metrics for various things. Cheers.
BRAVO! hands down the best blog I have read thus far, and girl have I read a ton of them! thank you! and good job!
Good post. Thanks for directing me to it. This information falls in line with what I hear from my co-workers. I work at a digital agency for my day job focusing on Adwords and the facebook team have given me insights here and there. I gotta be careful about letting on, why I am asking… My challenge is getting people to convert once they hit the lead capture page or event registration page.I am now testing a Call for Free Recorded Message.
No problem! Yea it does sound more like a landing page problem than a FB Ad problem to me.. Claire used to have a course on how to create landing pages that convert but I think she is currently updating and upgrading this so it’s not currently for sale sorry…
There are a lot of resources you can find on how to increase the conversion rates of your landing page though. Something easy you can do is use a well-known landing page creation software that conversion test their landing pages (like LeadPages) – that way you know you’re starting with a good template – you just need to plug your own text in.
In terms of data, the lowest conversion rate you should settle for is 20% but I normally aim for 40%+. If you can get it up to 20%, your cost per lead should drop though :) Good luck!
Hi Claire, love reading your article, full of important information. I’m wondering about how do you measure the effectiveness of brand awareness campaign? What is the benchmark rate of each measure mechanism?
Hi Claire, What are good ratios for % of FB video viewed per 3 sec. 10 sec. 25% 50% 75% and 95% long views? Also what are good conversion ratios 95% video view to Link Click and then Link Click to Lead on Ad Lead registration form?
Thanks for the great article!! I get confused by the data because from my ad they go to an article on my website first. There I have a button to a leadpage created with leadpages. But which data is about my own article and what is about the leadpage itself…?
Great article!