In an attempt to work with more students without having to leave her house to do it, Deany Judd took a traditional tutoring business online. She was able to work with far more students, make more money, and manage a flexible schedule that allowed her to spend time with her growing family.
Eventually Deany’s online tutoring business exploded so much that she brought on more tutors and leveraged technology in order to teach more than one person at a time. After founding an online school that continues to be successful, Deany now helps other interested teachers and tutors transition from in-person classes to the world of online education. (She’s also got a fantastic URL: howtotutoronline.com.)
She had just begun playing around with Facebook ads for her business when she hired me as her coach. The objective was to get more people to opt into her Online Tutors’ Starter Kit.
The Initial Ads
If you’re working with me, I won’t let you run just one ad at a time: instead you have to test ONE variable by running two ads at once.
Here are the ads Deany put together after our first session:
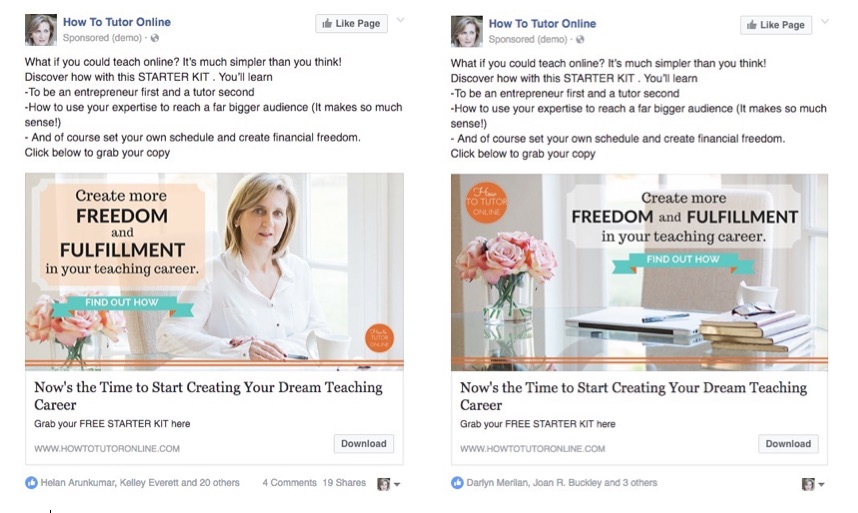
As you can see, the copy on both ads is the same; we were testing out two different images.
It wasn’t long before we had the “winner” of this test: the ad with the image of a desktop dramatically outperformed the image of Deany. Check out the cost-per-conversion data in the red box:
In case it’s hard to read those numbers, the ad called “Desk” brought in 45 sign-ups for £1.76 while “me at desk” got 18 sign-ups for £3.30 each.
Other important numbers to think about:
There’s lots of data in that screenshot, but I outlined the Link CTR in blue for a reason. (Translation: the percentage of people who viewed this ad and also clicked through the link over to the opt-in page.)
I usually aim for a Link CTR of 1.25 or higher. The Desk ad’s Link CTR was 1.11% while “me at desk” got a 0.95%. These aren’t terrible CTRs, but I thought we could do better. More on that below.
A Complete Shift In Strategy
After discovering a “winning” ad like this one, I normally encourage people to stay the course and test something else that’s closely related to the original test. (For example, the winning image with 2 new sets of ad copy, or the same exact winning ad with a brand new audience.)
But Deany’s own experimentation gave us a unique view into the mind of her target audience.
In between our coaching sessions, Deany saw that a blog post she had linked to on her Facebook page was getting some extra traction. She decided to boost it to see what the response would be like.
What happened? People started clicking like crazy. Here’s the post she boosted, plus the data below it:
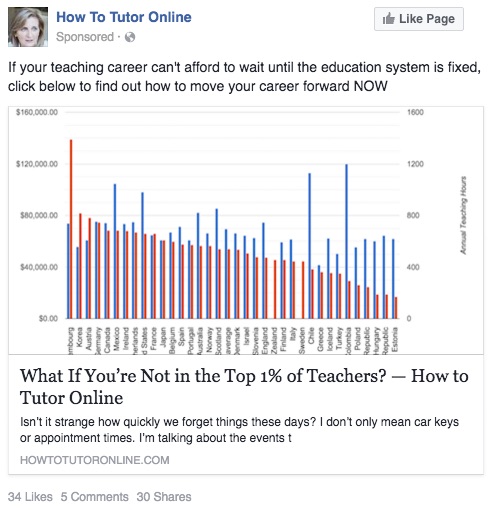

As you can see this boosted post got a TON of clicks (880) and had a really high Link CTR (3.39%). The cost per sign-up, however, was higher than the first set of ads we ran (£3.00 each).
I’m not surprised at all by the expensive cost-per-lead; remember, this boosted post was driving traffic to a regular blog post. Even if there’s a strong call-to-action included, most blog posts don’t convert visitors to subscribers at a high rate.
But what we did learn from this experiment is that this text-and-image combo was REALLY appealing to Deany’s audience. The headline clearly grabbed people’s attention and tapped into the common desire most people have to be great at what they do.
And that image? If you’re sitting there thinking “what is it about that kinda ugly graph that made people click?” then you’re not alone. I was baffled too! But it doesn’t really matter why it was an effective image, but rather that we figured it out!
Working With Valuable Information
Thanks to this boosted post, we knew exactly what kind of copy and image to try out in our next campaign. This time, though, I encouraged Deany to rework her opt-in page so that it included the image of the graph and a lot of the same text that was in her blog post. She didn’t have to change her opt-in content, just reposition it.
Deany recreated the exact same ad, this time linking it to her new opt-in page.
(This page has gone through several iterations since this initial test, but you can see the current version here.)
These were the results:
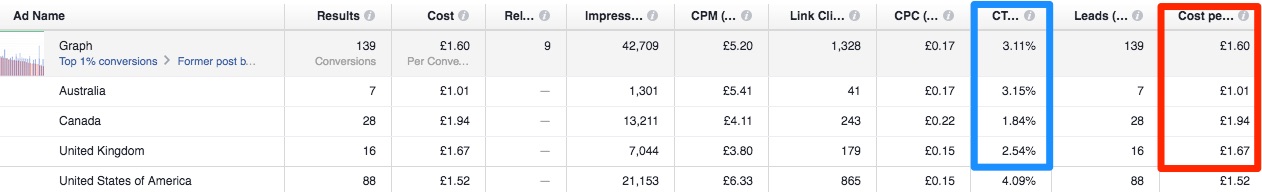
Take a look at top most row in gray to see the average data from this campaign. You can see that we still got a very high Link CTR, but that the average cost-per-sign-up came down from £3.30 from the boosted post to just £1.60.
Even more interesting, though, is the breakdown of these results by the individual countries included in the target audience. The country that got her the cheapest leads was Australia, while people in the U.S. clicked through her ad at an even higher rate.
As a result, Deany started splitting up her ad sets by country so that she could dedicate a specific amount of her budget to further testing which countries responded best to her ads.
Are all these numbers making your head spin a bit?
I know, all this data can be REALLY confusing. Click here to read more about the important metrics related to your Facebook ads.
But I’m showing you all this to encourage you to:
- Learn to read the results of your ads beyond just the number of conversions and the cost-per-conversion.
- Take the info that’s buried in your results and keep on testing new things!
In preparation for a launch later this year, Deany’s still playing around with different ads and figuring out just what makes her audience click and then convert. It takes time, yes, but she’s managed to bring her cost-per-lead down to £0.40 in some campaigns!
Let’s test and tweak your campaigns together, shall we?
Join me inside my signature Facebook + Instagram ads course, Absolute FB Ads!